Introduction
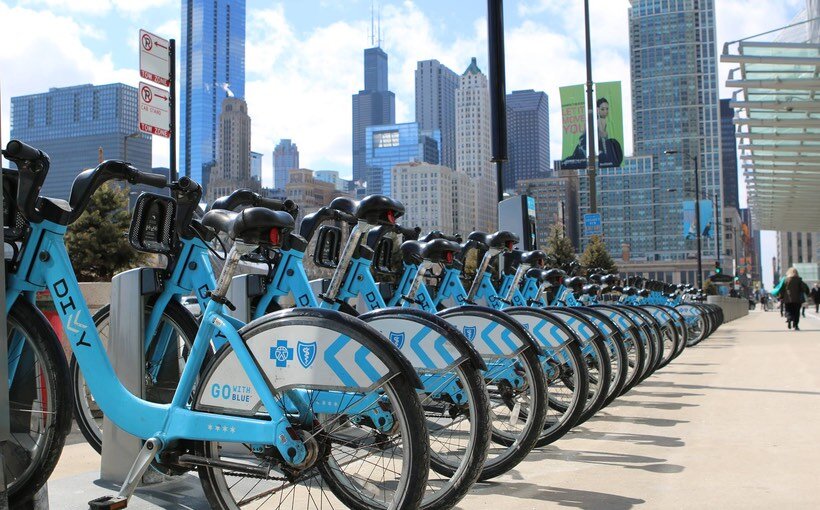
In 2016, Cyclistic launched a successful bike-share offering. Cyclistic is a Chicago-based bike-share program that features nearly 6,000 bicycles and more than 600 docking stations. The bikes can be unlocked from one station and returned to any other station in the system anytime.
Customers who purchase single-ride or full-day passes are referred to as casual riders. Customers who purchase annual memberships are Cyclistic members.
Cyclistic’s finance analysts have concluded that annual members are much more profitable than casual riders. Marketing team believes that maximizing the number of annual members will be key to future growth. Rather than creating a marketing campaign that targets all-new customers, Team believes there is a very good chance to convert casual riders into members.
Problem Statement
Marketing team has set a clear goal: Design marketing strategies aimed at converting casual riders into annual members. In order to do that, however, the marketing analyst team needs to better understand how annual members and casual riders differ, why casual riders would buy a membership.
Our part of the problem is to answer: How do annual members and casual riders use Cyclistic bikes differently?
Process
Since the data is very huge I have used R for the cleaning and transformation purpose. The data is available in Year wise, So, I have clean the data for each year and makes some new column to to analyse namely
- ride length: difference between start time and end time
- round trip: if the start station and end station are same or not
- year: by extracting year from the start date
- month: by extracting month from the start date
- day of week: by extracting weekdays from the start date
And aggregate them by median (not mean, since the data contains many outliers). You can check my cleaning process here for different years data:
- Cleaning of 2016-2017 data
- Cleaning of 2017-2018 data
- Cleaning of 2018-2019 data
- Cleaning of 2019-2020 data
- Cleaning of 2020-2021 data
Note: I have used from 2016 year data since the program of bike-share has started from this year
Solution
We will use Cyclistic’s historical trip data to analyze and identify trends. Data is available here. The data has been made available by Motivate International Inc. under this license.
This is public data that I am using to explore how different customer types are using Cyclistic bikes.
Note: Cyclistic is a fictional company which we are using for this case study. y. For the purposes of this case study, the datasets are appropriate and will enable us to answer the business questions.
Visualization
Presentation
Challenges
Data-privacy issues prohibit you from using riders’ personally identifiable information. This means that I won’t be able to connect pass purchases to credit card numbers to determine if casual riders live in the Cyclistic service area or if they have purchased multiple single passes.
Conclusion
After transforming the data, I have analysed and suggested top three recommendations: Marketing team should/can -
- introduce monthly or quarterly passes so the people will find it more affordable so they will attract towards our annual program
- come up with a plan or program for mid year or tourists passes where bike usage increases due to tourists activities
- give discounts or coupons for weekends so people will buy the passes more on weekends thereby relying more on our bikes
Next Steps
Marketing teams should make a survey focussing on the motivation of using bike for daily work or any other usages so as to better understand the feeling of the customers
They should also consider the migrant population and how they build trust with them.


